Before I took the job I asked for three years of financials and spent a few days on them. The annual figures were good. Revenue up roughly a quarter a year, margin improving, profit growing faster than revenue. On paper it was a business that had worked something out.
The monthly figures were a different company. In the year before I joined, the worst month lost more than it billed, and the best cleared forty percent. Cash said the same thing from another direction. The firm was carrying about a month of operating expenses in the bank, against liabilities of roughly three times that.
Both sets of numbers were accurate. Only one of them described what it was like to run the place.
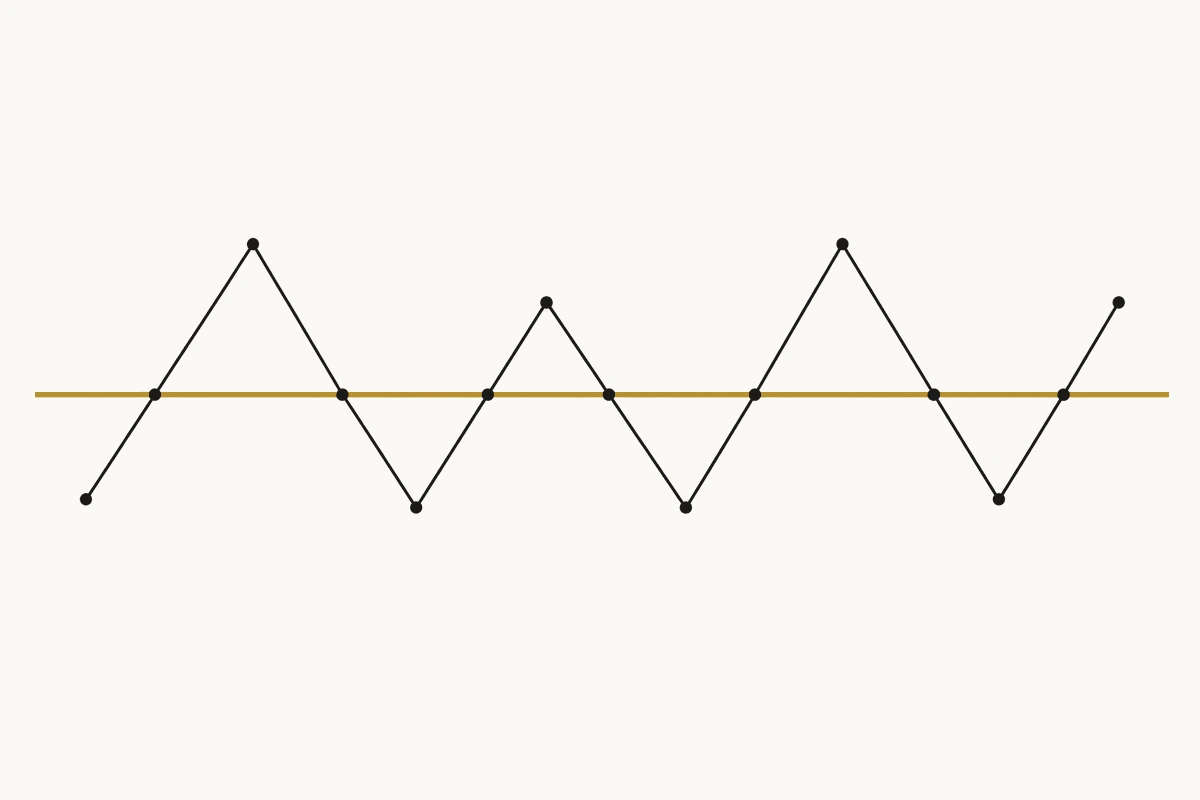
That gap is what this piece is about. An annual figure is the average of twelve different businesses, and the average is usually the one month that never happened.
Here's what I got wrong at first, though. I treated the swing itself as the finding. It isn't. Wide variance measures uncertainty, not health, and plenty of businesses carry violent monthly swings with nothing broken underneath them. A business can also be perfectly steady and quietly dying. The swing is a reason to look. It doesn't tell you where.
What told me where was a year of monthly statements, sorted four ways.
Find the line
Average the total monthly expense over the last three to six months. If expenses are steady, three months is enough. If the business oscillates hard, take twelve, because a short window lands on an unrepresentative month and hands you a line that's ten percent off in either direction.
That average is the revenue the business has to clear every month to stay level. Now count how many of the last twelve months came in below it.
Most owners have never run this and are surprised by the answer. They can name the bad months. They can't name the line, so they've never noticed that the bad months aren't events that happened to the business. They're the months revenue fell short of a number that doesn't move when revenue does.
That last part is the mechanism, and it's worth being precise about it. Costs do move. Once I was inside and had fourteen months of my own numbers, monthly expenses ranged by a factor of 1.6, which isn't nothing. But revenue ranged by 2.1, and more importantly the two didn't move together. In the three worst months revenue fell to roughly three-quarters of its average while expenses stayed at ninety percent of theirs or above. When revenue dropped, costs mostly stayed where they were.
That gap is the whole thing. A business operating close to its break-even line converts a modest revenue wobble into a violent margin swing, because the structure underneath the line doesn't flex. The same rigidity that punishes you in a weak month rewards you in a strong one, which is why the swings look symmetrical and feel anything but.
Split the expenses four ways
Once you have the line, sort every dollar of expense into four groups and read each as a percentage of revenue, month by month and quarter by quarter.
Production is the salaries of everyone doing the work clients actually pay for. In professional services this is usually the largest group and the one owners are least willing to examine, because it has faces attached to it.
Marketing is everything spent on getting found and getting chosen, not just ads. Agencies, vendors, tools, events, the retainer nobody has looked at in two years.
Owner compensation includes benefits and perks, not just the salary line. Owners resist calculating this one honestly, which is a good reason to calculate it first.
Everything else is rent, software, insurance, professional fees, and the accumulated subscriptions. It's the boring group and it's where slow leaks live, because no single item in it is ever large enough to trigger a review.
Reading them as percentages rather than dollars is what makes this work. Dollars rise when the business grows, which tells you nothing. A group holding its share of revenue while revenue climbs is behaving properly. A group climbing as a share while revenue climbs is a leak growing alongside you, and the dollar figure will never show it, because the dollar figure is supposed to be going up.
Month to month exposes shocks. Quarter to quarter exposes drift. Drift is the expensive one, because it never announces itself. Nobody calls a meeting about a group that gained one point a quarter for six quarters.
At that firm the answer came back quickly. Marketing was the largest controllable group by a distance, and in a business holding about a month of cash it wasn't a number to debate in the abstract. It was consuming cash before the cash existed, in profitable and unprofitable months alike. What to do about it turned into its own long project, and a separate lesson.
Then look somewhere expenses can't reach
The four groups find money leaving the business for less than it's worth. There's a second category that has nothing to do with expenses at all, and in owner-led firms it's frequently larger.
Of the work that actually got done, how much was billed? Not invoiced late, not written down at the last minute under pressure. Billed.
Of what was billed, how much arrived?
And then the money that leaves without ever touching the profit and loss statement. Owner draws. Loan repayments. This is why a business can post a profitable month and lose cash across the same thirty days, and it's the item most likely to be invisible to everyone except the person doing it.
None of these show up in the expense groups. Any of them can be larger than everything you'll find there. An owner tightening spend while a fifth of completed work never gets billed is optimizing the wrong dimension entirely, and doing it with real conviction.
What the line changed
Knowing the line made two things possible that hadn't been before.
The first was cash planning. Once you know what the business has to clear each month, you can see a crunch forming instead of discovering it, and you can decide in advance which month you're going to protect. Before that, cash was something that turned out.
The second was that the heavy groups became identifiable rather than arguable. Everything that followed came out of the same analysis. Staff whose output couldn't be connected to the work clients paid for were given outcome-based targets and incentive plans built around them, and some of them didn't make it. By month three I had restructured the pricing. Low-margin offers that consumed disproportionate attention were marked for retirement, and a high-margin one that collected on engagement was built to replace them, which mattered as much for the cash timing as for the margin. The marketing question turned into its own long project.
None of those were separate initiatives. They were four consequences of one afternoon of sorting.
The other thing that happened is the part I'd repeat anywhere. The analysis stopped being an analysis. It turned into reporting we reviewed weekly by department, and the individual pieces went to the people whose work they measured, so they could see their own numbers without waiting for someone to tell them. A diagnostic you run once tells you where you were. The same diagnostic running continuously is how the business gets steered.
The order
The line, the four groups, the leaks. It's the examination, not the treatment. It tells you where to look, not what to do.
It's an afternoon's work with a year of statements, and I run it before forming opinions about a business, because the alternative is forming opinions first and then finding numbers that agree, which is most of what passes for planning. Establish what's true, set a goal the truth can carry, then work out the actions between the two. That's the TAG method — See the Truth. Implement Actions. Achieve your Goals.
Most businesses start at the goal, because the goal is the enjoyable part. Then the plan gets built on a number nobody checked, and eighteen months later the business is still crossing the same line in both directions, and nobody can say why the plan didn't hold.